
This comes from the file content/analysis.Rmd.
In the United States, politics has shifted over the past two decades in that there are now new challenges to address to maintain American democratic institutions. Never has this been more pressing since the January 6th Insurrection against the US Capitol and by extension the US government in regards to certifying the 2020 election results for a peaceful transfer of power. With growing calls throughout the nation to overturn election results in certain municipalities or overall states, it calls into question how the nation got here, so that certain groups of people would favor not necessarily one political party, but overall practices that blatantly are non-democratic, or authoritarian.
Hence for this project, the analysis will pertain to not just the growth of this attitude towards authoritarianism overtime, but also covering certain societal factors that might influence the way people, and perhaps might capture the overall growth of authoritarianism in the country. This naturally will lead towards certain questions that hopefully this analysis will answer, which are:
Is there a particular societal attitude that seems to correlate with higher favoritism towards authoritarian politics?
Are there certain regions in the country that favor authoritarianism?
Is there a partisanship difference between Democrats, Republicans, and Independents/Other Affiliations regarding favoring authoritarian politics?
We generally hope to have a thorough explanation and examination of these questions throughout this analysis.
To begin with, there are four particular variables that we are concerned with in this analysis that captures societal attitudes, which are Rural Outreach, Attitudes towards Women’s Role, Child Discipline vs Independence, and overall Foreign attitudes.
Rural Outreach would refer to whether or not people in rural areas feel as if the government does enough to support them or not.
Attitudes towards Women’s Role refers to whether or not the people feel as if the demand for women’s equality with men in society would allot towards special privileges for women
Child Discipline vs Independence refers to whether or not these voters feel as if their children should either have respect for authority or be curious enough to possibly question it
Foreign Attitudes refers to whether or not the respondents feel as if the United States is the best country or not
After cleaning the datasets (please refer to the Data Page on this website for more information), it was determined that these four variables are key to measure the societal attitudes that might make a voter be more enticed to support authoritarian policies/politicians. From there, it was determined that a linear regression could still be possible.
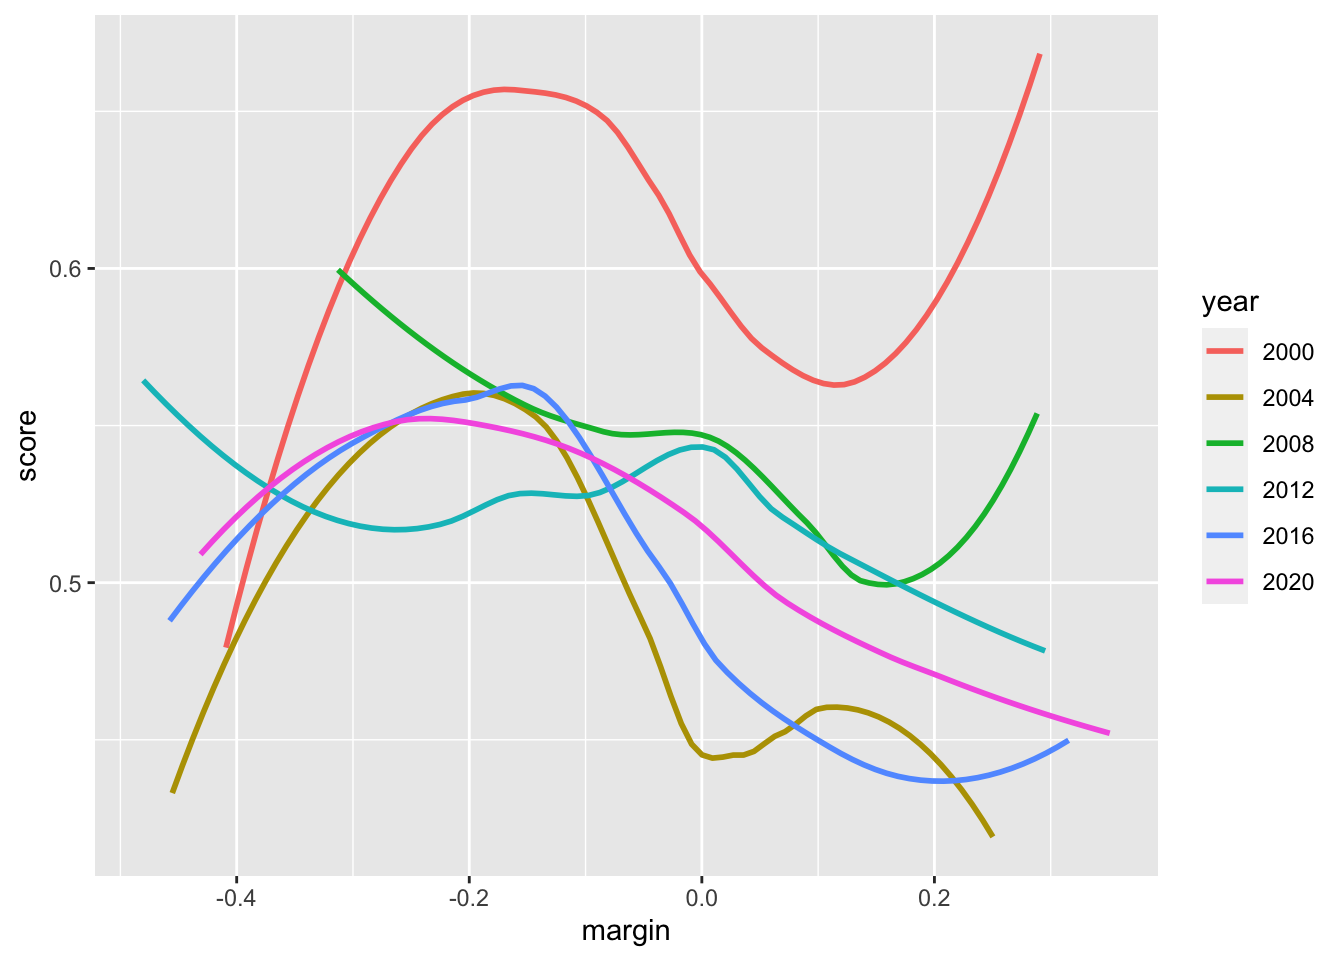
This overall graph details the overall authoritarian scores throughout each election, in which the margin of how much each state voted for the Democratic candidate with a positive margin indicating the states that voted for the Democrat and the negative margins referring to Republicans. As one can see, those states that are have a large Democratic base seem to score lower in regards to being authoritarian than their Republican counterparts. It would seem that while there was a general decrease in these authoritarian tendencies in these mainly Democratic states throughout the two decades. When it comes to the overall states that have a lower margin for the Democratic presidential nominees, they generally have higher authoritarian scores in comparison to their counterparts that voted for the Democrat. While this graph does note that there is a decrease between 2020 and 2016, this could be due to the fact that 2020 had significantly higher turnout and was in a national environment that favored the Democratic candidate. What should be noted though is that between 2012 and 2016 there seems to be the biggest difference regarding attitudes towards authoritarianism within states that favor one particular party. Democratic states seemed to significantly decrease their authoritarian score, while those who lean more Republican seem to have a notable increase.
| score | |||
|---|---|---|---|
| Predictors | Estimates | CI | p |
| (Intercept) | 0.60 | 0.58 – 0.62 | <0.001 |
| margin | -0.12 | -0.17 – -0.07 | <0.001 |
| year [2004] | -0.12 | -0.16 – -0.09 | <0.001 |
| year [2008] | -0.06 | -0.10 – -0.03 | <0.001 |
| year [2012] | -0.09 | -0.12 – -0.06 | <0.001 |
| year [2016] | -0.11 | -0.14 – -0.08 | <0.001 |
| year [2020] | -0.09 | -0.12 – -0.06 | <0.001 |
| Observations | 251 | ||
| R2 / R2 adjusted | 0.300 / 0.283 | ||
The overall model judging from its p values (at least for all terms in the model) does test to be significant, although in regards to any sort of correlation seems to be a bit low due to the low R^2 value. However, the R^2 value does indicate that there might be more evidence towards a relationship between the partisanship and the overall authoritarian score, in which case one could look into the above variables to determine whether or not there could be more of a fit.
Hence, there is a need for a new model to try and address this shortcoming of the previous model, in which case the social variables explained earlier should be incorporated. Now, it should be noted that due to the fact the Rural attitudes only was measured for one of the elections, it was stricken from this model as there was not enough data to justify its incorporation.
| score | |||
|---|---|---|---|
| Predictors | Estimates | CI | p |
| (Intercept) | 0.02 | -0.00 – 0.04 | 0.056 |
| margin | -0.00 | -0.01 – 0.01 | 0.646 |
| cs | 0.37 | 0.35 – 0.39 | <0.001 |
| ws | 0.50 | 0.45 – 0.54 | <0.001 |
| fs | 0.10 | 0.07 – 0.13 | <0.001 |
| year [2020] | 0.05 | 0.04 – 0.05 | <0.001 |
| Observations | 100 | ||
| R2 / R2 adjusted | 0.986 / 0.986 | ||
The new model in which incorporates most of these societal figures does seem to do a much better job at identifying whether or not there is a relationship between authoritarianism and these overall factors. In this particular model, the R^2 value is so close to one that it implies there is not only a relationship, but a strong relationship between these factors and an overall authoritarian attitude. While the margin of victory for the Democratic candidate did not test signifcantly in this model, it will be left there as it is important to include some variable that captures partisan attitudes.
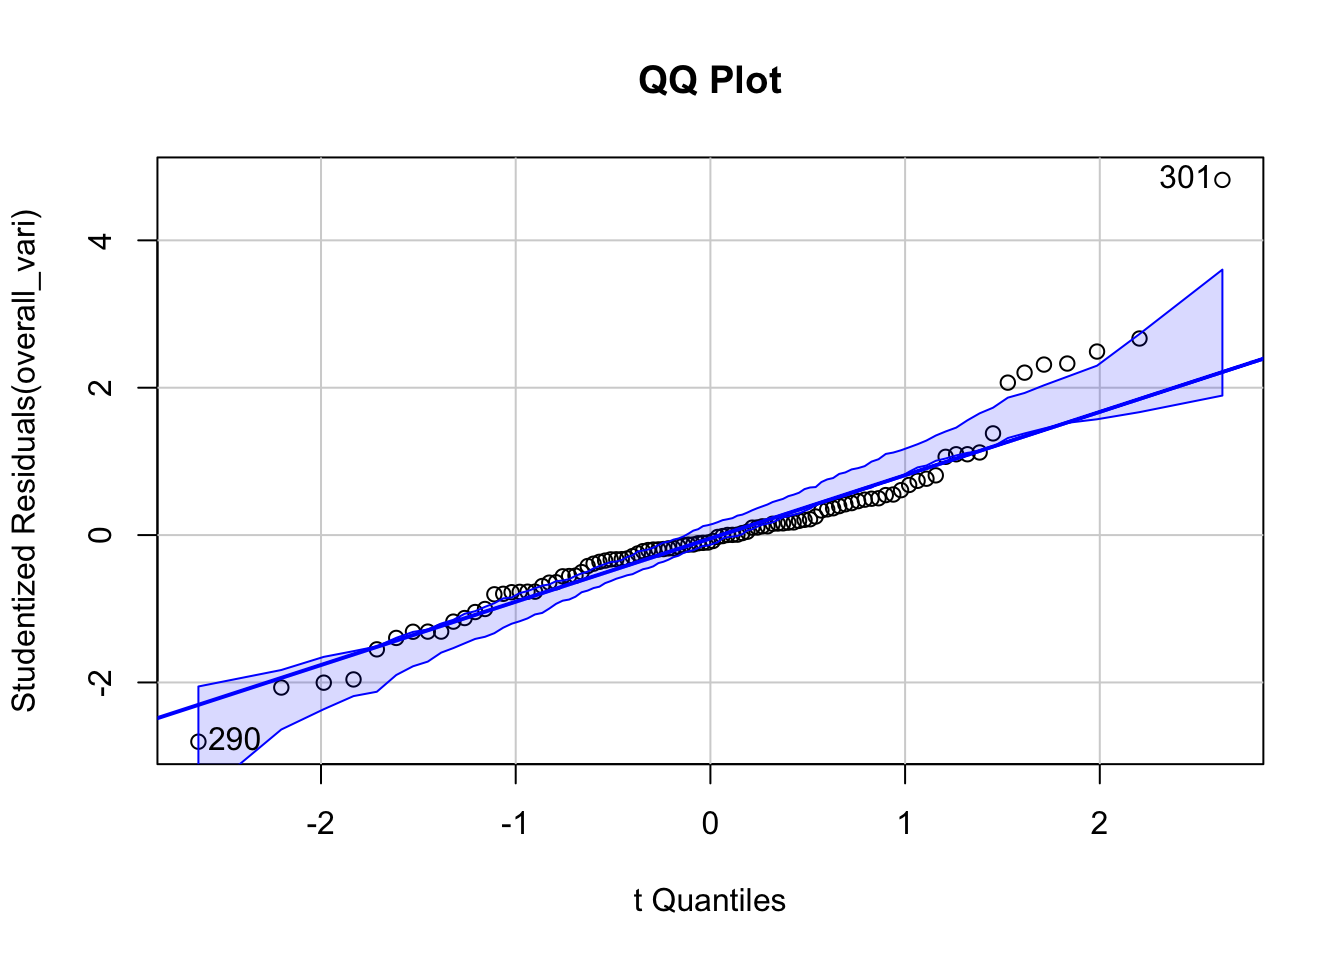
## [1] 290 301Judging from the resulting QQ plot for this new model, the model does seem to generally do a good job in fitting the data, as the residuals do seem to be in a general range that they are a 1 to 1 relationship. That being said, the slight deviations away from the line implies the model could do a better job at least in capturing the relationship as a whole. Seeing that a normalization transformation has already been taken into account in order to fulfill the requirements for a linear regression, this would imply there might be other variables at hand that influence this relationship that are not present in the current model.
The overall conclusions that can be drawn at least from this analysis are that Republicans are more likely to be drawn towards authoritarian politics in comparison to their Democratic counterparts. In states therefore that lean or are strongly Republican, it can be expected that in these regions authoritarian policies might be favored. All of the societal variables seem to have an important part in regards to an authoritarian attitude (as they all tested significant in the model diagnostics) and hence should be considered in future models.
In regards to how to improve this analysis, it can probably be split into two different issues regarding either the data or the model. It is no secret that collecting this sort of data can be hard, and hence in this analysis certain states did not manage to actually collect the data on these societal variables in certain election years. While there was still plenty of data to work with, it would be nice to have to truly solidify this analysis. Additionally, seeing that the people surveyed every year are not the same people, it might be hard to truly capture the development of authoritarian attitudes as some of these people can therefore stay at home instead of voting, and therefore not be accounted for in the data. If it were possible to survey these active voters consistently throughout the elections, that would be a nice way to truly capture an evolution of authoritarian views.
Regarding any improvements towards the actual analysis, technically speaking the data is a time series. Hence, any models related to such data (like an ARIMA model, nonparametric analysis, or panel analysis) might capture the behavior of the data better than a simple multilinear regression. Additionally, the data might benefit from a regional factor, that is sorting the data (seeing that it is bined by states) into the Census-designated regions of the country to see if there are just plain regional differences in regards to these authoritarian views. Some of these societal attitudes might be influencing one another as well, it wouldn’t hurt to see if there are any relationships between the two. It should be noted that the societal factors done within the data have a part in calculating the authoritarian score within the data, hence there should be a better method to separate the direct influences the factors have on each other. The only reason why they were included in the final model was to try and capture those societal attitudes as best as possible given the circumstances.